Tuesday, March 6, 2012

Database Marketing: Data Mining for CRM & Internally

With so much marketing-relevant data available out there it's easy to get overwhelmed. No marketer has time to manually interpret such vast amounts of information and make glean relevant insights to inform their marketing strategy. By the time all the data is processed it could already be on the verge of becoming irrelevant! That's why utilizing database marketing is an excellent way to monitor marketing performance.


Your iPhone can tell you how much you walk on average every day, provide GPS maps of everywhere you go, how much you drive, your browsing data, what music you listen to when you're exercising, what kind of food you prefer when you order delivery... In order to measure marketing effectiveness, local businesses could either pay for this information, or create an app that could collect this information itself. Changes in that data could be monitored before and after a campaign is run by way of data mining. Same with loyalty cards at grocery stores, email lists, browsing trends from ISP’s, and the list goes on.

One way marketing can utilize this kind of information internally is to find out who performs best on their sales team or on their customer service team and find correlative data that might be relevant to their productivity/success.

I’ve attached this obliquely related article from AdAge partially because it’s an interesting take on a specific aspect of database marketing, but mostly because the headline includes the term “offer anarchy,” which I very much enjoy.

Interesting Marketing Metrics Cheatsheet

Marketo's "Marketing Measurement" cheat sheet.

Webinars Better Than Face-to-Face?

Last year I read a whitepaper about how webinars generate better ROI than in-person events. The paper was sponsored by GoToWebinar so I take it with a grain of salt, but the research is pretty interesting. The paper, written by Quantum Leap Marketing and Osterman Research, suggest that small and medium-sized businesses are generating more qualified leads and reaching a larger audience by hosting online events for marketing purposes.

Webinar services are reasonably low cost (or free if you get creative with chat or Google Hangouts), and the only investment is the time it takes to create the presentation and deliver it. No booth rental fees for trade shows, no printing costs for collateral.

You can download the whitepaper here.

In World of Marketing, Analytics Software is King

When it comes to tracking marketing efforts, analytics softwares are crucial tools for being able to measure success. Even Facebook has integrated it's own analytics software to aid its users in measuring the more difficult to track social media realm.

Take the mobile app world for example. There are two types of key software that measure different and important metrics.

1. External Performance - These softwares track and aggregate important external information such as downloads, sales, reviews and ratings.

This type of data can easily be used to analyze the effectiveness of marketing activities. Do some marketing, see how it effects downloads.

2. Internal Performance - These softwares track and aggregate data from user interaction with the app such as time spent using app, number of times app is used, most used app function etc.

This type of data can be used to understand the best features of an app without even having to ask users. These features can then be focused on in marketing campaigns to make them more effective.

External Performance Example:

In my work with a local mobile app company we were able to significantly and sustainably alter the sales of one particular app.

At point 1 we released a dual iPad/iPhone build that combined both apps into one that was compatible with both the iPad and iPhone. Combining downloads had a positive effect on rankings, pushing us to the the number one spot on the App Store for both devices for the keyword 'Statistics'.

At point 2 (2 days later) we sent out an Apple specific press release (PRMac.com) targeting iPhone and iPad app consumers, promoting the fact that we had the the number one statistics app on the App Store.


While it's impossible to determine exactly how much of this maintained increase came from being number 1 for both devices for that keyword and how much came from the press release, we do know from the internal PR analytics that our App Store link has been clicked on hundreds of times and the release itself has been viewed 18,000 times, thereby making it likely that the PR played a significant role in driving these increased sales.

The PR only cost $19 and an app that was averaging $6 per day now averages $26 per day.

Track to measure success

There are quite a few ways to measure if the social media campaign is working or not. The qualitative measure of success could be engaging with the followers on the social channels like:
- seeing what are some of the keywords used when social users are talking about the company.
- what positive or negative comments they are sharing about your brand
- how loyal fans are by seeing how often they mention the name of the brand.
- seeing if there are any negative customers towards the brand.
- seeing how your company measure against your competitors.

Some quantitative measure of success could be:
- Urchin UTM analytic tracking on Facebook and Twitter channels. Determine the traffic coming in from the social channels to the website.
-Booking widget on Facebook
-Channel insights. All the major social channels have their own analytics dashboard or unique ways to track activity. Using the specific insight analytics reports, you can benchmark performance indicators month to month gauge improvement.

http://blog.milestoneinternet.com/roi-tracking/measure-social-media-goals/

When enough is enough?

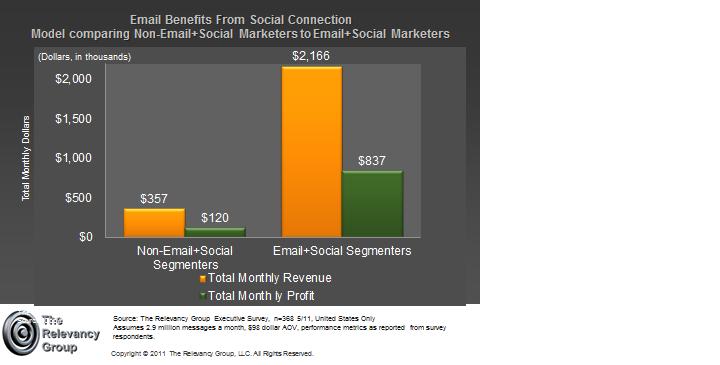
Over the weekend, I came across this article about "Driving the ROI of Social and Email Marketing" from a company called The Relevancy Group which I thought was quite fitting for this week's blog. In the beginning of the article, it talked about how email continues to be used each day by businesses to communicate with their customers about their current promotions, events, etc. However, with the onset of several marketing channels there are available to all of us both businesses and consumers, it then becomes apparent that consumers can easily be bombarded with several emails in a day (depending on how many they are subscribed to of course) and because of that somehow we can't blame them if they decide to opt-out simply because out of "annoyance". So what gives? Nowadays, the key is for businesses to be able to keep up with the ongoing growth of marketing methods available to and for them and be relevant to their customers when they are trying to reach out to them especially if it's by way of email.


Another interesting bit from this article is what it said about how marketers must know how to connect social and email marketing to advance customer relationship which is what every business should keep as top priority. It's all about creating relationships so what better way to create better relationships with your clients by listening to their needs, their wants, it's all about them and that's what makes a good marketer. People will be much more drawn to support a business if they know and feel that it cares for them other than just making profits off of them.


Measuring Alignment


As important it is for businesses to measure marketing effectiveness, so is evaluating marketing and sales alignment. Marketing working in isolation can’t produce the best results for a company. Aligning the two departments can significantly improve marketing ROI as well as sales productivity. There is no dearth of techniques out there to measure the success of marketing efforts, but what if we would want to understand how aligned (or misaligned) marketing and sales are.

The Forbes article addresses this very issue. It talks about three key metrics that a company can use to measure the degree of alignment between marketing and sales.
§  End-to-End Conversion Metric - “Measures the conversion ratio for the full revenue cycle well as for each of the major stages – from market attraction through sales close and customer lifetime value.”
§  Revenue Diversity Metric - “measures the productivity of lead generation.”
§  Outcome Profitability Metric - “measures profit attributable to each specific business problem or “outcome” sold to. This gives visibility into how well sales and marketing understand the buyers, their business problems and how effective they are in pursuing those opportunities.”

Although measuring these metrics needs quite a bit of serious work, it surely seems to be worth the process as these are the starting point of understanding how closely or how apart are the two departments working.

Monday, March 5, 2012

Measuring ROI through Engagement

With the rise of social media and websites such as Facebook and Twitter, Marketing ROI has encountered a new level of complication. With fans, likes and followers, it appears that Marketing ROI has been simplified, the more fans the more return on investment.

But recently in marketing, research is showing that more fans doesn't actually equal more value. If a large number of fans are inactive or unresponsive what value do they really have? We have learned that more companies are narrowing in on a smaller, more focused core group of fans or followers. By targeting a more concentrated demographic that is truly interested in a companies product, the company is getting more value than by pushing information onto a larger less interested crowd. True fans or followers appreciate the core information being shared with them and are more likely to then be active participants in the conversation, even starting conversations themselves on behalf of the company.

Therefore its not the number of fans you have but rather the amount of participation and engagement that your fans give back in return.Companies such as Facebook offer corporations insights on the number of followers they have but also by calling out the number of people are respond, repost, talk about your company and the overall reach. Through engagement and quality referrals from consumers, companies are benefitting more than by simply having huge followings.

Here is a summary of the insights that Facebook provides:

The Insights dashboard gives you more insights on the content that users view on your Page.
  • Page Views: Total number of views of your Facebook Page, during the date range you specified.
  • Tab Views: Number of views that each tab on your Page received when logged-in users visited your Page, during the date range you specified.
  • External Referrers: Number of views coming from the top referring external domains sending traffic to your Page, during the date range you specified.
  • Media Consumption: After you post a Facebook video, a photo, or an audio clip, users are able to click to consume that piece of content. This data corresponds to number of views of that your videos, photos and audio clips received on that day, during the date range you.

Sunday, March 4, 2012

Measuring Marketing Wins

Every organization wants to measure return on investment. Marketing budgets are often on the chopping block. So how do marketing departments determine the return on investment for each of their activities? There’s an old adage that says half of all advertising dollars are wasted, the problem is figuring out which half. Umm, that’s a problem.

Baseline statistics are out there for all kinds of marketing initiatives, which people can compare to their own numbers. Tools and tips for measuring response from direct mail (use of special URLs or phone numbers to measure which piece generates leads, expected response rate of 1-2%), web advertising (number of times an ad is served up, the click through rate, the number of conversions, average click through rate of banner ads is currently 0.2-0.3%), number of impressions combined with detailed audience segmentation information from media outlets, etc. All of this data, of course, then gets paired and parsed with business financial information showing sales numbers across products, product lines, and the company’s product mix.

Needless to say, there’s a lot of math. Marketing includes a ton of statistical analysis. It’s like the analytics movement in the NBA in the early 2000s or the recent movie Moneyball with Brad Pitt, except instead of trying to build a baseball team built on statistics that is most likely to generate wins, marketing teams are trying to build a marketing program built on statistics that is most likely to resonate with the audience. Marketing’s win equals influence. Influence is different from a purchase.

Most people think of marketing as something that tries to get us to buy something. Most of the commercials on TV want us to spend money on something, right? Yes. But a purchase is only one aspect of marketing. An important part, a measurable part, but not the only part.

What if a company or organization isn’t selling a commodity that can be easily quantified? What if it’s an organization that works to clean the ocean? What if it’s an organization that provides free educational webinars? What if it’s an organization that promotes healthy eating? I have one book on my shelf about strategic communications for non-profits. This 266-page book has nine pages dedicated to measurement and evaluation strategies. Nine pages! Running a quick statistical analysis, that means marketing in non-profits should only spend three percent of their time on measuring success.

Wow. Do non-profits not care about measuring the return of their marketing efforts? Absolutely not. In fact, many non-profits are finding their budgets particularly depleted during this economic downturn and are trying hard to make strategic decisions to maintain effectiveness. They know that they need marketing to make a difference, but they don’t have answers about what is particularly effective. Sure, many non-profits can measure against different metrics, like how many people walked through the front door, how many square miles of ocean were cleaned, how many people logged into the webinars, but let’s look more closely at the healthy eating example. Let’s hypothesize that you work for this organization and that your top three communications objectives are to educate the community about:

1. the benefits of eating healthy food
2. what foods are healthy
3. how to prepare food

How do you measure if you have been successful? Surveys, focus groups, key informant interviews…these are all possible, but they’re not all-inclusive. You could partner with local markets and ask for reports about types of food purchased, which may or may not be possible, prohibitively expensive, or an effective measure. And how do you know if the results of the campaign are long-lasting? Suddenly, measuring the impact of an organization’s marketing efforts just became even more challenging than it already was. How do you quantify social change?

I would love to hear your thoughts, suggestions, ideas! I’m always looking to improve our methods of measuring effectiveness. Please comment, shoot me an email, or send me a message on twitter (@missiethurston).

Every Picture Provides a Metric?

Less than two years ago, I was personally involved in designing a way to measure the engagement of first time members as well as the treasured "net promoters" for a large nonprofit.  Capturing "engagement" is tricky ... especially for a nonprofit.  There are surveys, and click throughs, and all sorta of things which, in a nonprofit setting, are difficult to find the true outcome even it you can capture it all.

Just recently, I came across an article on SelfGiving -- produced by Joe Waters -- that talked about the value of a new platform called Pininterest and the value of it especially in a nonprofit sense.  Comparable to a Facebook Likes promotion, Pininterest is easier to use (which is especially valuable for smaller, shoestring nonprofits) and conceivably affords some simple ways to achieve real and tangible measures and value.

One simple and obvious measure is the pinning of a picture by an engaged user.  Beyond that, such "pinning" could be tied to fundraising -- that is, for each "pin," a company or corporation could make a contribution.  Beyond that, the use of Pininterest at present would position a nonprofit as a social media leader.

The "buzz" generated with potential partners and the opportunity for online and on the ground social media has real value.

Regardless, Pininterest has the underpinnings of the potential new Facebook perhaps?

"Hovering"


"Is 'Hovering' the Future of Online Cause Marketing?" is an article posted on SelfishGiving and outlines a new online content services that allows for users to have deeper engagement with website content.  Essentially it takes the idea of hyperlink words and phrases a step further by providing readers with additional information when they "hover" over keywords or icons.  The difference is that you need no ever leave the page.

Peapod and Starbucks are just to examples of companies who use an the online service of Swoop.  And it isn't just generic information.  Users get information that is localized and personalized based on a user's history.  

It seems not only opportunity for companies to further promote their own company and products, but to join synergistically with other companies to promote brands and products.  It is, perhaps, the opportunity for "product placement" online?


New Media and Business as Usual

It appears that there is no shortage of tools for measuring different metrics around social media activity. Counting likes on Facebook is simple enough. Searching Twitter gives you good insight into real time brand conversations. What do likes, shares, and tweets ultimately mean for the organization?

This interesting case study of Burberry discusses how the company used Social Media as the focus of its launch of "Body." The success of the campaign was measured by using real world metrics showing a 29% increase in revenue. In the same article, Alex Pearmin of Q2 makes an insightful statement about the presentation of social media within the context of the organization, "Don’t shove the youngest guy in the room in front of them and say “we must do it because it is what the kids are doing”. Marketers need to present social media marketing as part of an overall integrated marketing strategy.

In a separate article, author Erica Swallow seems to agree with Alex Pearmin's sentiment by presenting 3 Things to Consider when measuring Social Media ROI. 1. Social Media is the Vehicle, not the Destination. 2. Listen and Apply Learnings to Every Department. 3. Performance Metrics are Media Agnostic.

These articles do an excellent job of presenting the value of social media, and how the value is dependent on the structure and metrics of the individual organization.

Saturday, March 3, 2012

FREE insights by Facebook

Facebook provides page admins with a powerful and free tool to measure the performance of Facebook pages. Thanks to the Facebook insights page admins can  "understand and analyze trends within user growth and demographics, consumption of content, and creation of content, admins and developers are better equipped to improve their business with Facebook" (Facebook help center)


The Complete guide to the new Facebook insights is a great article that will help you understanding how to measure your success!


Cost of Customer Acquisition vs. Monetization metrics

This is an interesting article for start-ups about balancing the costs of new customer acquisitions and the resultant monetization (lifetime value) of new customers. There is a very understandable infographic that purports to show how marketing efforts drive acquisition costs. The author includes two example spreadsheet calculators that show how you might measure acquisition costs. In particular, the authors argue that inbound marketing lowers the acquision costs, while outbound marketing raises those costs.

Friday, March 2, 2012

Weird, Freaky, Stupid, Cool

Weird, freaky, stupid and cool were all words credited to HSBC's Your Point of View initiative to increase account activity and a unique case study for marketing metrics. HSBC combined event, social media and promotional give-a-way marketing claiming thousands of  impressions doubling new account openings at their fifth avenue bank. Account openings are revenue generating activity for the company but it is difficult to give credit to the marketing without the necessary metrics.  HSBC was able to launch and event that was newsworthy in and of itself, the media budget was state to be zero. This free coverage for engaging content is clearly a message as it can be easily compared to the cost of paid media to reach the same number of viewers.    Account openings directly equate to bank revenue and are a high quality metric for marketing success. The company can compare the campaign openings number vs openings not credited to other business circumstances or forecasted seasonal traffic. Tracking the number of these customers that continue to keep their the account would further prove the effort created a  sales which marketing accomplishment that influences the balance sheet. 

Wednesday, February 29, 2012

ROI (and CYA)

Since entering the industry, I've heard many variations on this theme: Marketing ROI is difficult. In the last five years, it has started to (almost) always be accompanied by the caveat, "...but it's necessary."

In context, the aughts were tough times, with the bursting technology bubble, 9/11, and the Great Recession topping the list of events that had significant impacts on the U.S. (financially, politically, and culturally). It was also the decade of Web 2.0. (Yikes, I'm way over my buzzword quotient already.)

And with a more social web, businesses were able to extract more data from their systems for analysis. Alongside this trend, companies also began to require more data from their employees in marketing. Nebulously referring to "brand awareness" was not going to cut it anymore. But how do you show marketing ROI? ...Especially if marketers as a group are perhaps closer to the art/language side of the equation than the math/science one (assuming for the purposes of this post that such a division can be made).

Regardless of the root cause, it seems fair to say that marketers were at least a little reticent to metricize their day-to-day--perhaps in part because of the dynamic concepts they deal in, and in part because of the freedom that comes with not being constrained by numeric analysis. But in the world we live in, justifying the ROI of your job (no matter what it is) can start to seem like a constant necessity, and marketers are no exception.

So in researching for this week's assignment, I came across a couple articles with some tips to help marketers dip their toes in the (math) water:

-The 10 Social Media Metrics Your Company Should Monitor

This article does a good job of breaking down some of the basics. Useful items to track include engagement duration, bounce rate, and brand mentions in social media. Examining these tactics can help marketers identify strategies to quantify what's happening in the realm of social media, and suggest related marketing opportunities. Once a core set of metrics has been established, marketers can also tailor their efforts/programs to enhance the numbers where they--or others within the organization--want to see growth. Which brings me to the second piece of content...

-Social Media Metrics

To me, this article/blog post was a good reminder that numbers aren't very useful without context. While not as heavy on practical information, the author emphasizes the importance of deciding which metrics to track based on specific objectives. I think sometimes people can get too caught up in all the pieces of data they can track and we forget that the numbers aren't an end in themselves. To me, this is especially true in an organization where different departments will have separate priorities.

Perhaps more significantly, the leadership team (and/or CEO) might have specific ideas on which elements of marketing they're interested in. Conversely, executives might come to you for guidance on which things the company should be tracking. Or some combination. The modern marketer needs to be knowledgeable enough to develop their own programs, but also flexible enough to tailor those programs to fit an organization's structure (and/or the proclivities of C-level personnel).

As Chris Brogan puts it, "Make up your own mind, [and] don’t ever let someone sway you that there are 'official' social media metrics that you must/should/need to track." So yes, make up your own mind, but don't be too surprised if someone more senior than you realigns your perceptions from time to time...

Marketers guide to Pinterest

Nice infographic

Tuesday, February 28, 2012

Social Media Marketing Mistakes

Social Media Marketing Mistakes - http://marketing.about.com/od/internetmarketingstrategy/a/socialmarketingmanners.htm

I chose this article because it reiterates a lot of the points we've discussed in class, but that are still overlooked in the day to day activities of businesses.

"Social media is about interaction, and if I've said this once, I've said it at least a hundred times: social media is about interacting! When you interact, you create relationships; when you create these relationships, you create opportunities to share your products and services."

Reinforcing the importance of relationships coupled with a few do's and don'ts, make this article a quick and informative read.

Heat Maps and Hot Ads

A co-worker recently passed on an interesting article that displays heat maps and talks about the top 15 facts about how people view websites. 

As you can see in the image below, it's clear that we (in the Western world) still view things from left to right and from top to bottom.


A couple of the more interesting highlights were that text attracts more attention than images do and that smaller text is viewed more than larger text. The reasoning behind this makes sense, but I was still surprised: the larger the content, the more it is viewed as "scanable." The smaller the content is, the more people have to focus their attention on the page. There is clearly a fine line between 'small and interesting' and 'too small and annoying', but this contrasts with the idea that everything should be large, eye-grabbing and heavy-hitting.